SmartAdmin Research
Detailed analysis, experimental results, and performance metrics from the SmartAdmin capstone project evaluation, including LLM interpretation accuracy, safety validation, and workflow efficiency measurements.
This section evaluates how accurately the LLM can interpret natural-language delivery modification requests and convert them into structured, validated action schemas.
 by Action Type.png)
The stacked bar chart provides a granular look at the classification outcomes across the 100 test messages, categorizing results into True Positives (TP), False Positives (FP), and False Negatives (FN). This distribution is critical for understanding the system's reliability in identifying actionable requests versus misinterpreting noise.
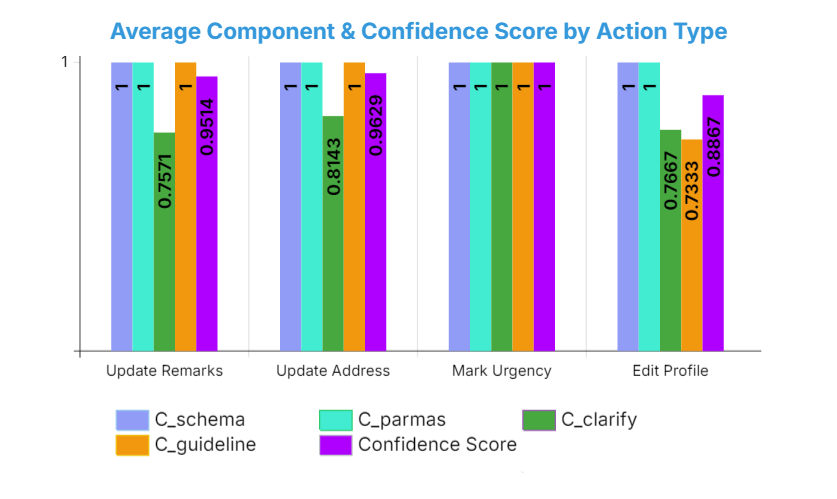
The chart illustrates the performance of SmartAdmin across the four primary operational domains. The Average Confidence Score serves as a composite metric reflecting the system’s reliability in instruction matching, action selection, parameter extraction and schema formatting.
Key Findings: These results validate that an instruction-centric RAG architecture effectively grounds LLM reasoning within uParcel's operational SOPs. While the tendency to assume parameters in ambiguous messages specifically when domain keywords like "profile" are missing remains an area for refinement, the overall high F1-score confirms that SmartAdmin provides a robust and accurate foundation for automated logistics administration
Evaluation of safety mechanisms including SOP-based validation, risk classification, human-in-the-loop review, and audit logging.
| Metric | Calculation | Result |
|---|---|---|
| False Negative Rate | Unsafe Actions Executed ÷ Total Unsafe Actions Submitted | 0% (0/24) |
| HITL Intervention Rate | Actions Requiring Human Approval ÷ Total Actions | 82.1% (23/28) |
| Traceability Completeness | Actions with Complete Logs ÷ Total Actions | 100% (28/28) |
| Safety Test Pass Rate | Safety Test Cases Passed ÷ Total Safety Test Cases | 100% (28/28) |
Key Findings:
Comparison of AI-assisted automation versus baseline manual workflows for delivery modification tasks.
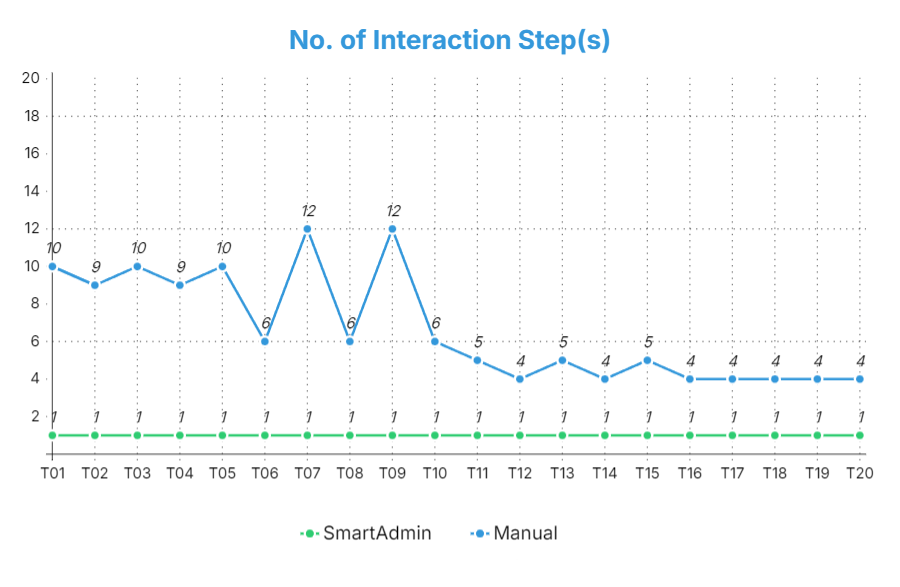
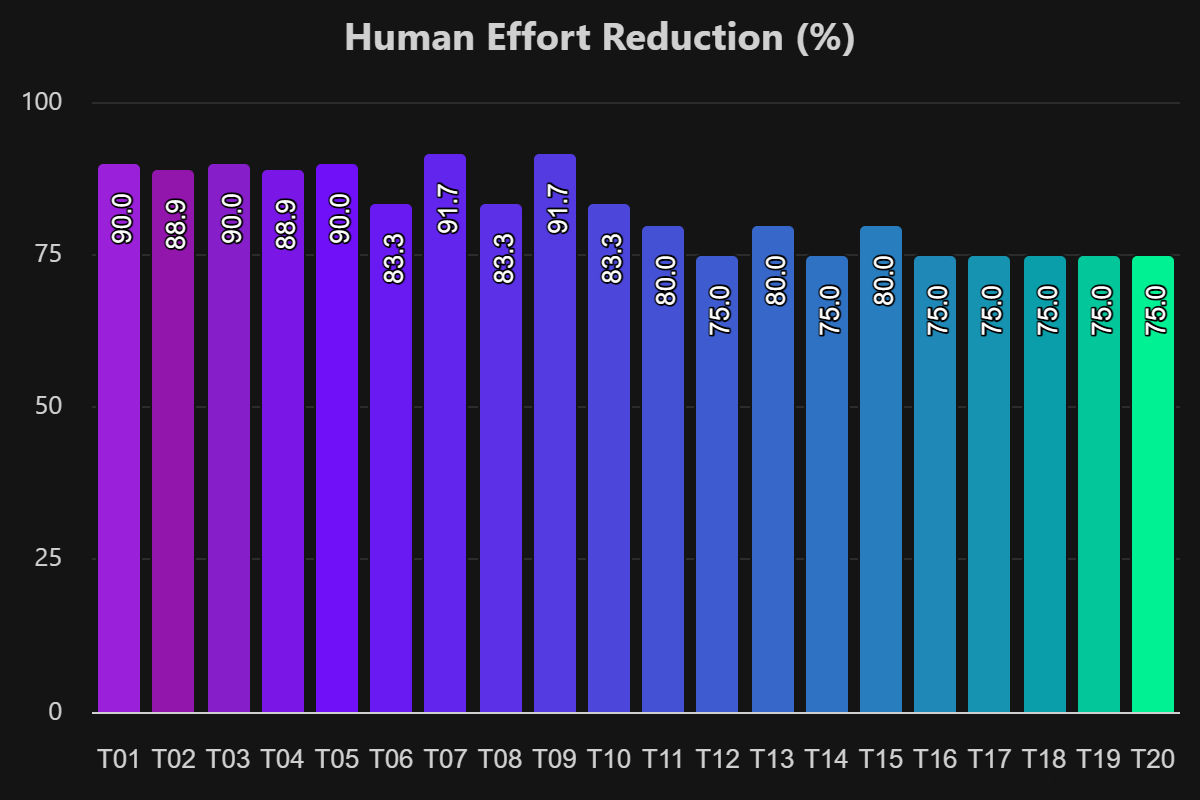
Across the 20 evaluated tasks, SmartAdmin consistently reduced interaction steps to a single confirmation step, while manual execution typically required between 4 and 12 discrete interactions per task. This yields a high Average Human Effort Reduction of 82.3056%, indicating that operators perform substantially fewer clicks and field edits when using the system.
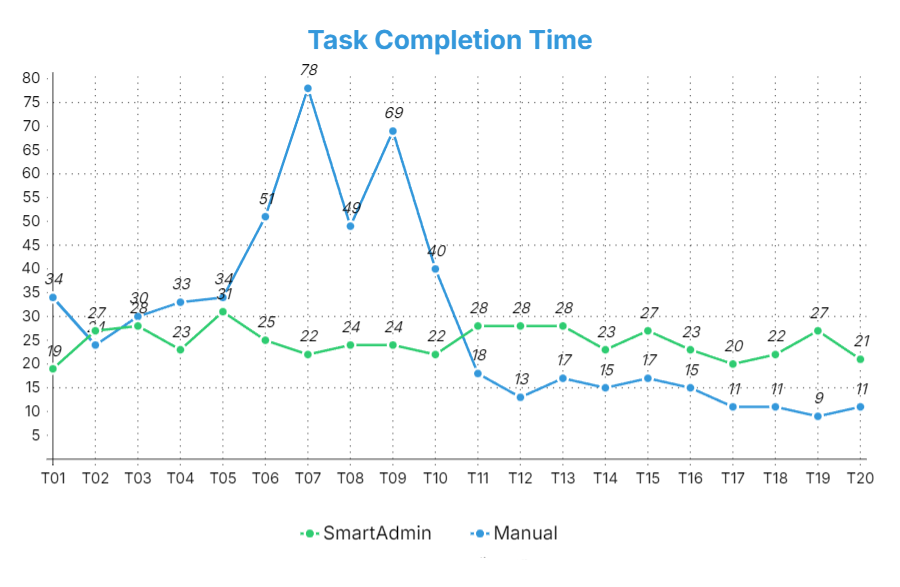
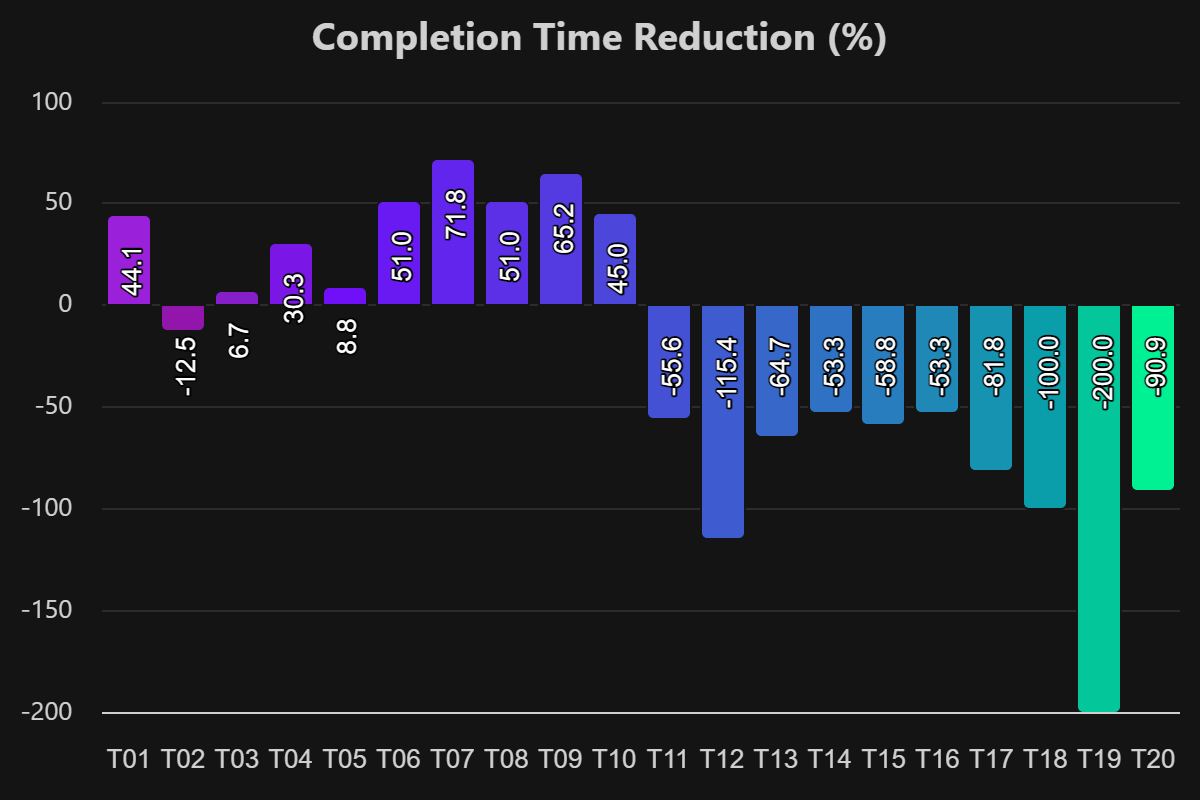
[Task Completion Time] compares raw completion times between manual and SmartAdmin executions for each task. For task T01 – T10, the SmartAdmin completion time hovers around 19-31 seconds, whereas manual completion can spike up to 78 seconds for the most complex address changes. For T11 - T20, manual completion drops to around 9 - 18 seconds but SmartAdmin remains close to its typical 21 - 28 second window which results in negative completion time reductions despite the lower interaction effort in the previous chart (Human Effort Reduction).
Key Findings: RQ3 provides a balanced and informative outcome where SmartAdmin achieves substantial reductions in manual interaction steps (82.3056% Average Human Effort Reduction) but currently increases average completion time (-25.622% Average Completion Time Reduction) across the full task set. This demonstrates that AI-assisted workflow automation is not universally superior to manual execution on every dimension. Instead, it introduces clear trade-offs between reduced operator workload and potential latency overhead. These findings suggest that SmartAdmin is most valuable for higher-volume or more complex routine tasks where click reduction and cognitive load matter, while very simple, low-latency operations may remain more time-efficient when performed manually unless further performance optimisations are implemented.